;
CLMOOC Make Bank
  • CLMOOC
  • Submit makes
  • Find makes
    • By category
    • By tags
    • Random make
  • About

Infographics Makes

Makes that mix text, images, and media to summarize information

There are 5 Infographics Makes. View sorted by

Map Your Network and Where You Engage

1 Star2 Stars3 Stars4 Stars5 Stars (No Ratings Yet)
Loading...

Created August 10, 2016 by Daniel Bassill • 1824 views • 0 examples • 0 tutorials

Map Your Network and Where You Engage

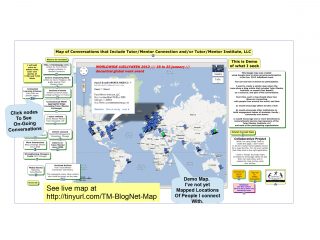
This graphic was created with a free CMap tool, and shows some of the people and places where conversations that relate to the goals of my organization, Tutor/Mentor Institute, LLC, are taking place. The intend is to provide an on-line space that anyone can go to find where these conversations are taking place, so they can join in, or so they can connect with the different people hosting the conversations. Many of the nodes point to people I’ve connected with in #clmooc. One points to discussions started this year, on engaging students and understanding clmooc participation. Others could create similar… Read more »

Make Details

A Wall of Quotes

1 Star2 Stars3 Stars4 Stars5 Stars (No Ratings Yet)
Loading...

Created November 21, 2015 by Kevin Hodgson • 2230 views • 0 examples • 0 tutorials

A Wall of Quotes

If you have ever dog-eared a book or used your highlighter (or highlighter app) to remember a quote of substance, then consider making a Wall of Quotes with other collaborators. One of the easiest sites to do this with is Padlet, which creates a virtual wall that anyone can add to. It allows for writing, images, and any other media you can upload or share via link.

Make Details

All systems go! – 2015 Make Cycle #4

1 Star2 Stars3 Stars4 Stars5 Stars (No Ratings Yet)
Loading...

Created July 14, 2015 by Kim Douillard, Janet Ilko, Janis Jones, and Abby Robles San Diego Area Writing Project • 3219 views • 1 examples • 0 tutorials

All systems go! – 2015 Make Cycle #4

According to the dictionary, a system is “a group of interacting, interrelated, interdependent elements forming a complex whole.” There are many types of systems: human, behavioral, natural, technological, mechanical, mathematical, political, social, financial, transit, etc. In this make, we invite you to document, analyze and reflect on the variety of systems that influence your life personally and/or professionally. Use your creativity to document an existing system, access your ingenuity to improve an existing system or use your imagination to develop a unique new system and design a novel way to explain it. How can you document a system that serves… Read more »

Make Details

How to Make a Snarky Flowchart

1 Star2 Stars3 Stars4 Stars5 Stars (1 votes, avg.: 5.00 out of 5)
Loading...

Created June 17, 2014 by Kevin Hodgson • 2909 views • 0 examples • 0 tutorials

How to Make a Snarky Flowchart

Flowcharts are conversations between the writer and reader. The best flowcharts (for me) are the ones that make me laugh even as I am learning. This Make is all about creating a snarky flowchart in the form of a snarky flowchart. Consider it a Meta-Snark-Chart, if you will.

Make Details

Infographics Unit 8 Grade

1 Star2 Stars3 Stars4 Stars5 Stars (No Ratings Yet)
Loading...

Created May 30, 2014 by Amy Cody Clancy • 2986 views • 4 examples • 2 tutorials

Infographics Unit 8 Grade

This unit is a rough day by day of an infographics instructional unit for grade 8 Writing. The goal is for students to examine infographics, determine what they are and are not, and to perform a mini-research project in order to create an infographic. Infographic Unit – Grade 8 Writing

Make Details


This site is licensed under Creative Commons licenses. See individual entries for specific licenses.

Terms of Use

built in collaboration with @cogdog, Educator Innovator, National Writing Project, K12 Handhelds, and the CLMOOC community